
Smarter operations for commercial buildings
Smart ventilation, heating and cooling.
Lower energy use.
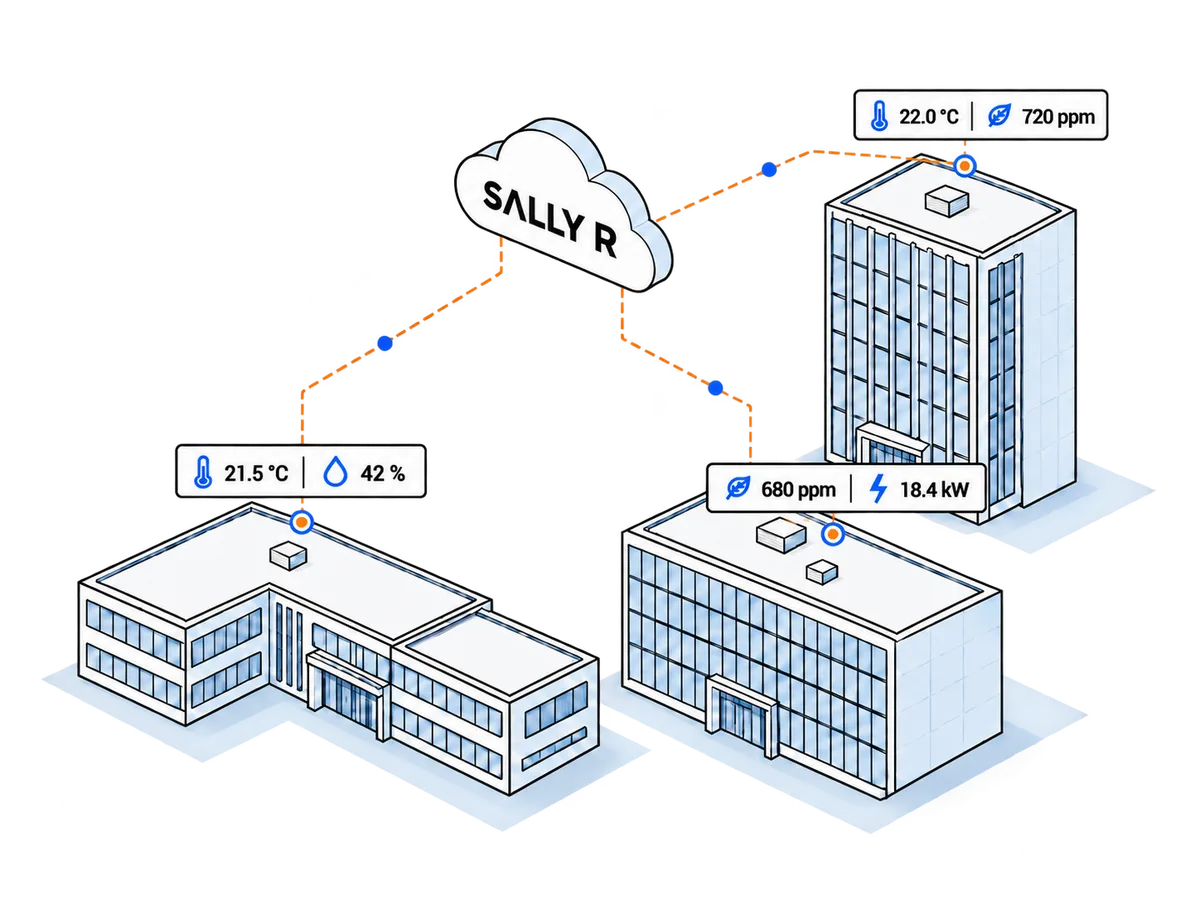
Sally R optimizes ventilation, heating and cooling around your building’s needs. We use current measurement data and predictive models to adapt control as conditions change and anticipate future needs. Through your existing control systems, we coordinate operation to reduce energy use and maintain your desired indoor climate.
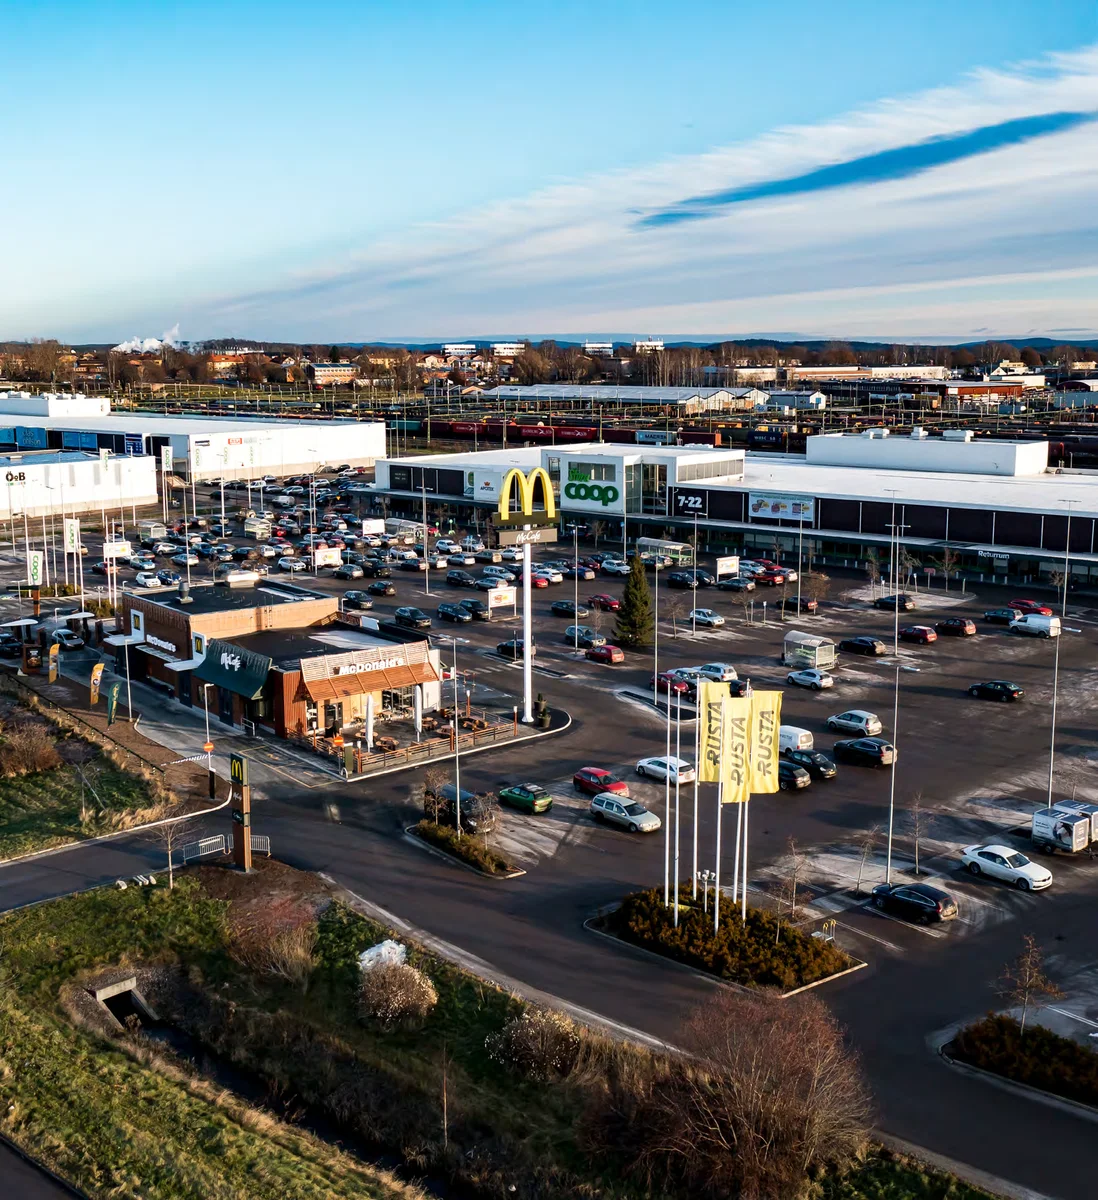
Customer case – Savills Investment Management
Handlaren 3, Norra Backa, Borlänge
At Handlaren 3, Sally R uses sensor data to continuously optimise building operations. Savills IM reports lower energy consumption and fewer manual adjustments.
- lower energy use
- 26 %
- kWh in calculated annual savings
- 300,000
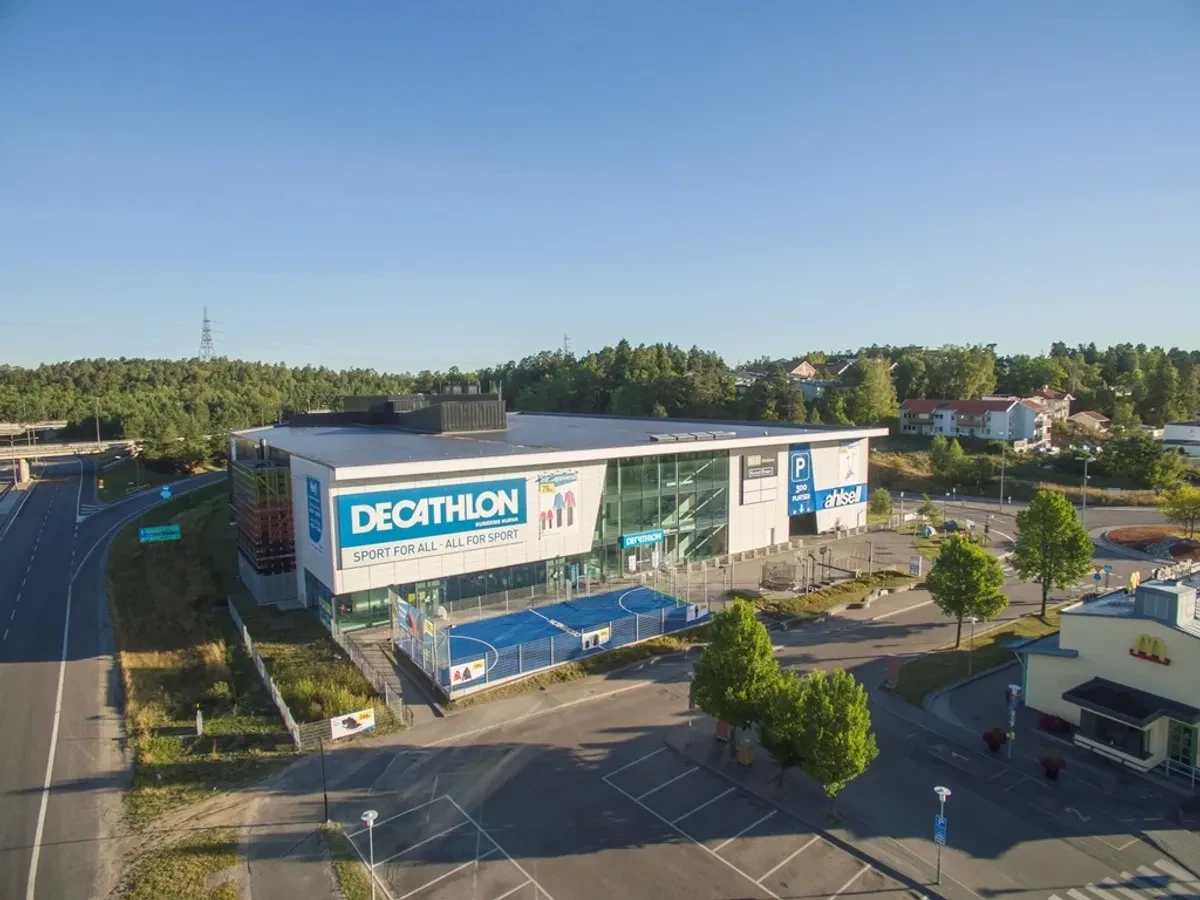
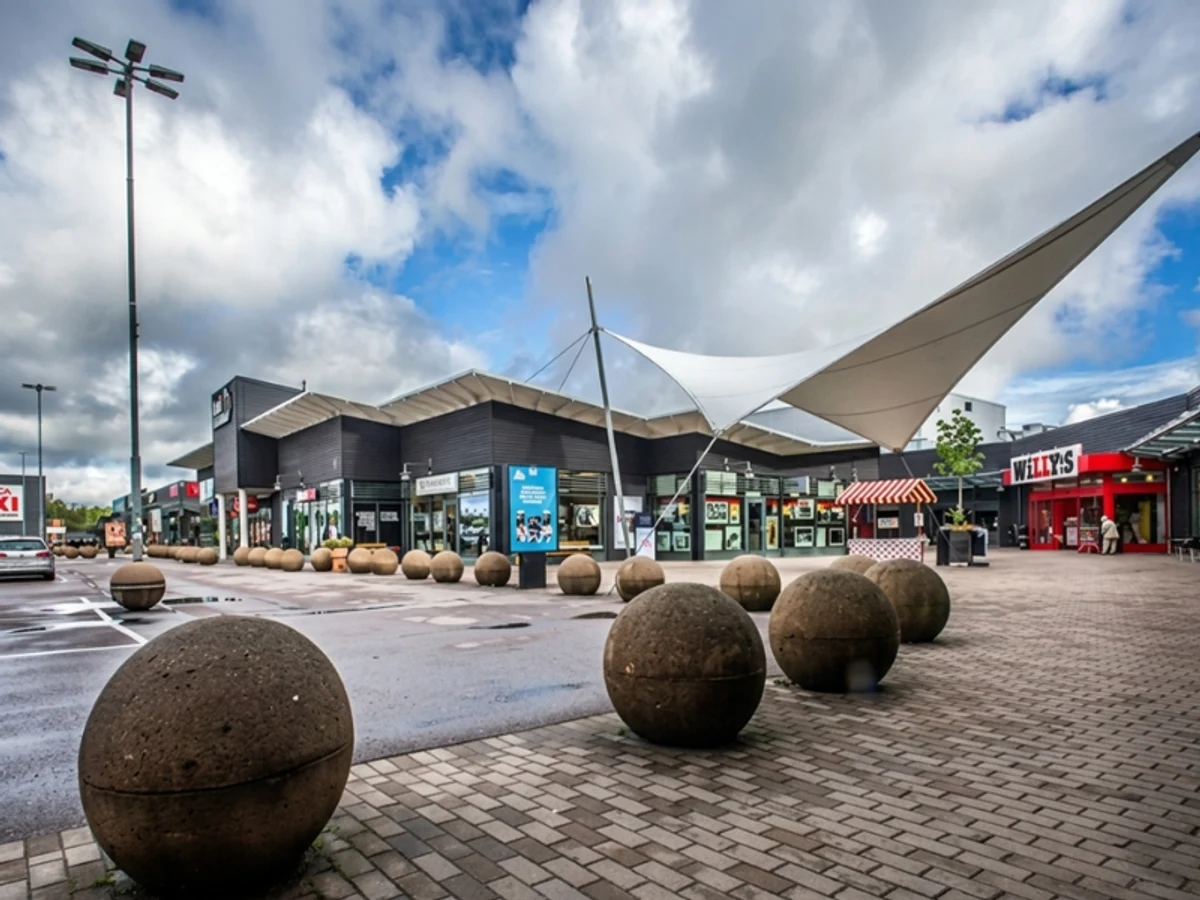
A selection of our customers







Lower energy use. A more stable indoor climate.
15–25% lower energy use
Continuous optimization of heating and ventilation reduces energy use without replacing existing systems.
A more stable indoor climate
Temperature and air quality are adapted to the building’s actual needs and set clear conditions for optimization.
Less manual operational work
Automatic control and clear follow-up make deviations and opportunities for improvement easier to identify.
Connected to your building
A smart layer above your existing control systems
Sally R combines indoor climate measurements and operating data from the building’s BMS or automation system with electricity prices, weather data and forecasts. We adapt operation as conditions change and use predictive models to anticipate future needs. This allows us to coordinate heating, ventilation and cooling based on both current conditions and what lies ahead.
We send adjusted setpoints back to the existing control system, which continues to control the installations. Sally R provides the overall optimization.
Connections and requirementsContinues to control the installations
Our partners






From fixed schedules to control that looks ahead.
Heating is reduced early in anticipation of forecast heat gains.
Right energy now. With the future in mind.
Building needs depend on the weather, the people inside and stored heat. Heating, ventilation and cooling therefore need to work together.
Traditional control: each system on its own
Fixed schedules and heating curves can supply substantial heat on a cold morning while ventilation runs hard. The systems can work against each other. When sunshine and more people later add heat, the building can overheat, increasing the need for cooling and boosted ventilation.
Sally R: the systems work together
We coordinate systems based on current measurements and forecasts of the building’s needs. Ahead of a warm, sunny day, we can reduce heating in the morning and adjust operation as conditions change. Ventilation follows air and indoor climate requirements, avoiding extra airflow to compensate for unnecessary heating.
FOR PROPERTY TEAMS
Energy and indoor climate, in one view.
Follow calculated energy savings and indoor climate across buildings, even with different control systems. The system also analyzes deviations in operation and indoor climate, giving your operations team a basis for further investigation and action.
Energy saved
Follow reported energy savings across your buildings in a shared overview.
Indoor climate
Compare indoor temperatures across areas and hours to see where conditions need attention.
Trends
Filter by building, air handling unit and heating circuit, and follow temperatures against their limits over time.
Issues
See deviations such as offline sensors or temperatures above their limits, grouped by severity.
Getting started
Three steps to a more energy-efficient building
We review the conditions together, connect your systems and follow up the results.
From our knowledge archive
Articles and insights
A selection from our news archive.
Explore articles and insights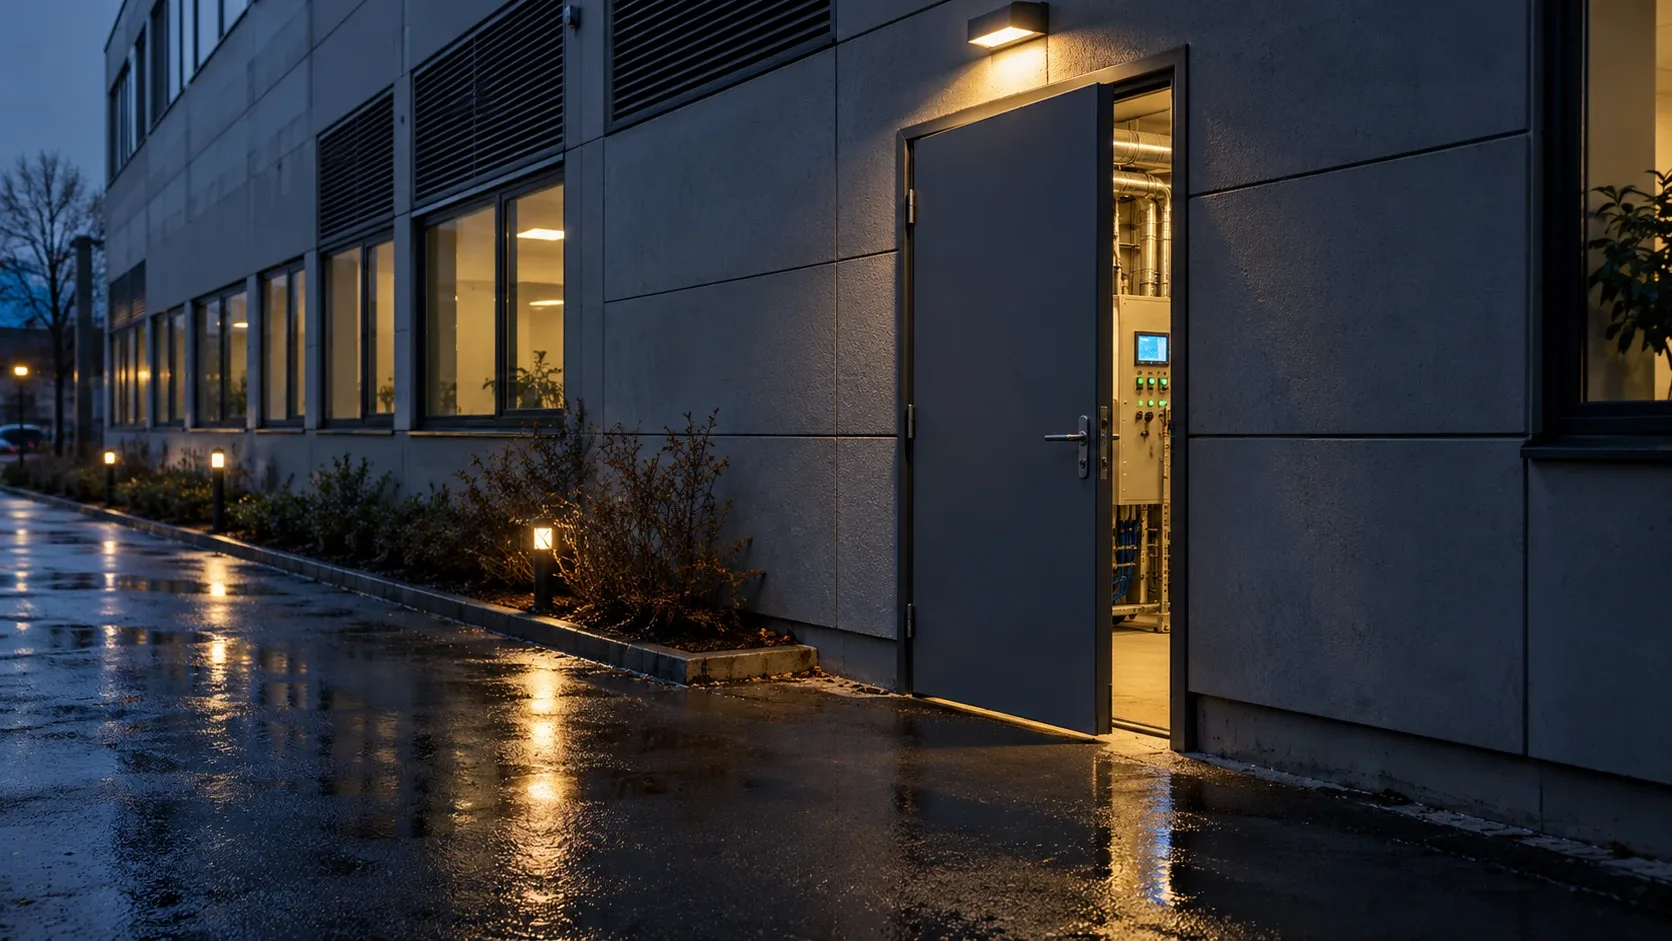
Are your buildings protected against cyber intrusions?
SVT, Sweden’s public service television broadcaster, has searched for Swedish control systems exposed on the internet and found systems controlling heating and ventilation in buildings, in one case without even requiring a password. For building owners and managers, it is important to know how their digital systems are connected.
Read more
New energy requirements: what needs to change in your building?
New energy requirements raise questions about investment, control systems and renovation. For commercial property owners, the work starts with understanding which requirements apply to their buildings and why they use the energy they do.
Read moreTalk to us about your building
Tell us what you would like to improve — energy use, indoor climate or day-to-day operations. We’ll explore how Sally R can help.